Telecom Call Data Record Analysis and Insights.
- Client is a company which deals with Unified Call Analysis.
- They are based out of the United States of America ( USA ).
-
Client needs to develop a POC ( Proof of Concept ) for one of its esteemed clients for Unified Call Data Record Analysis.
-
The challenge is that the CDR ( Call Data Record ) is in raw format and does not have column names also present and it has 435 columns in total. Contains date and time information in a regular pattern like- "2019 06 20 03 27 17.906". contains some unwanted data. Information spread across multiple columns
-
Need to visualize the Analytics for Call data, Device data and Service data.
-
We should be able to run the Python script from the command line and it should open a Web Page in the browser with a Descent and Usable Interface.
-
User should have an option on the Web Page to close the opened browser after his work is complete, it should also close/kill the script running in the background.
-
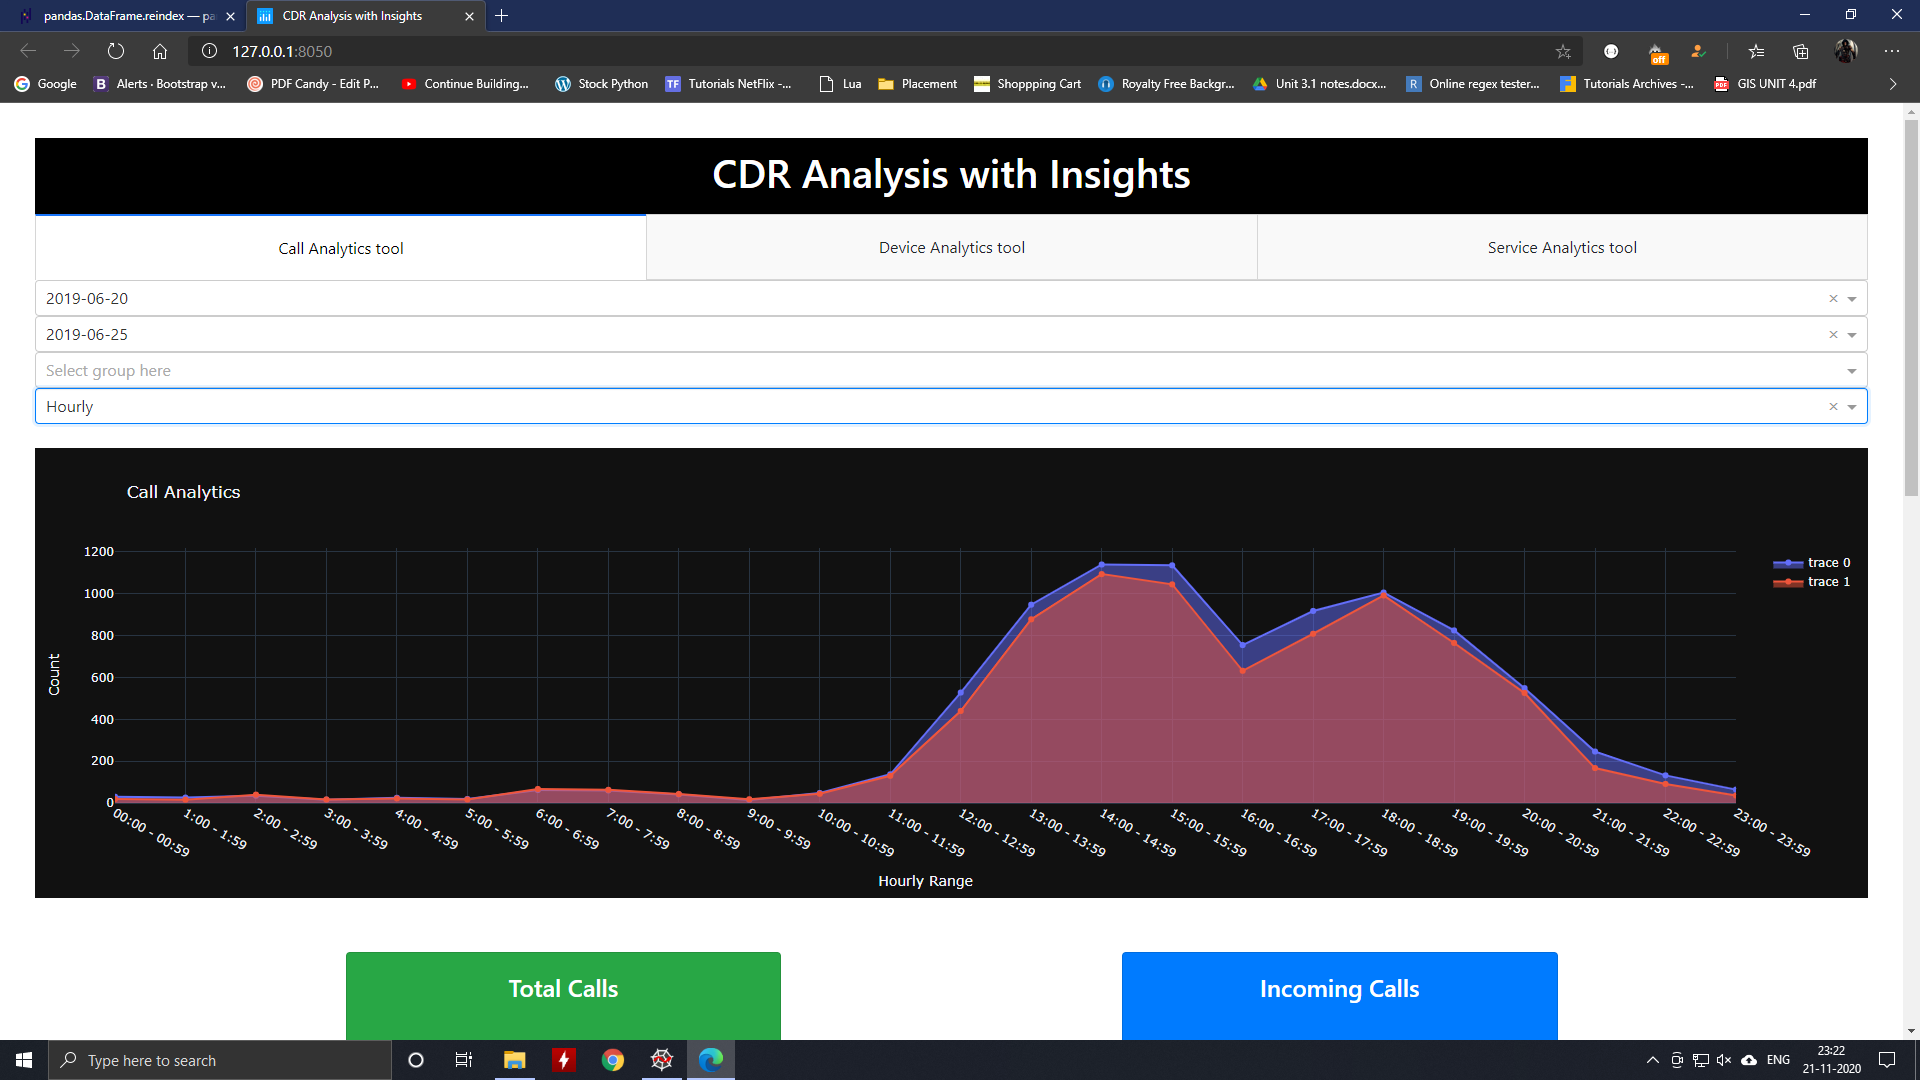
UI should have a Call Data Analytics (Interactive Visualisation) to generate a Line Graph based on the filtration of Start date and End date, Group and based on Hourly, Weekly and Daily. User should be able to select any Start Date and End Date, Group and Type of Graph and based on that we need to show the graph. We need to show important information like total calls, Incoming and Outgoing, Missed Calls, Max Duration etc in the form of Cards. Also show the records in the form of tabular data.
-
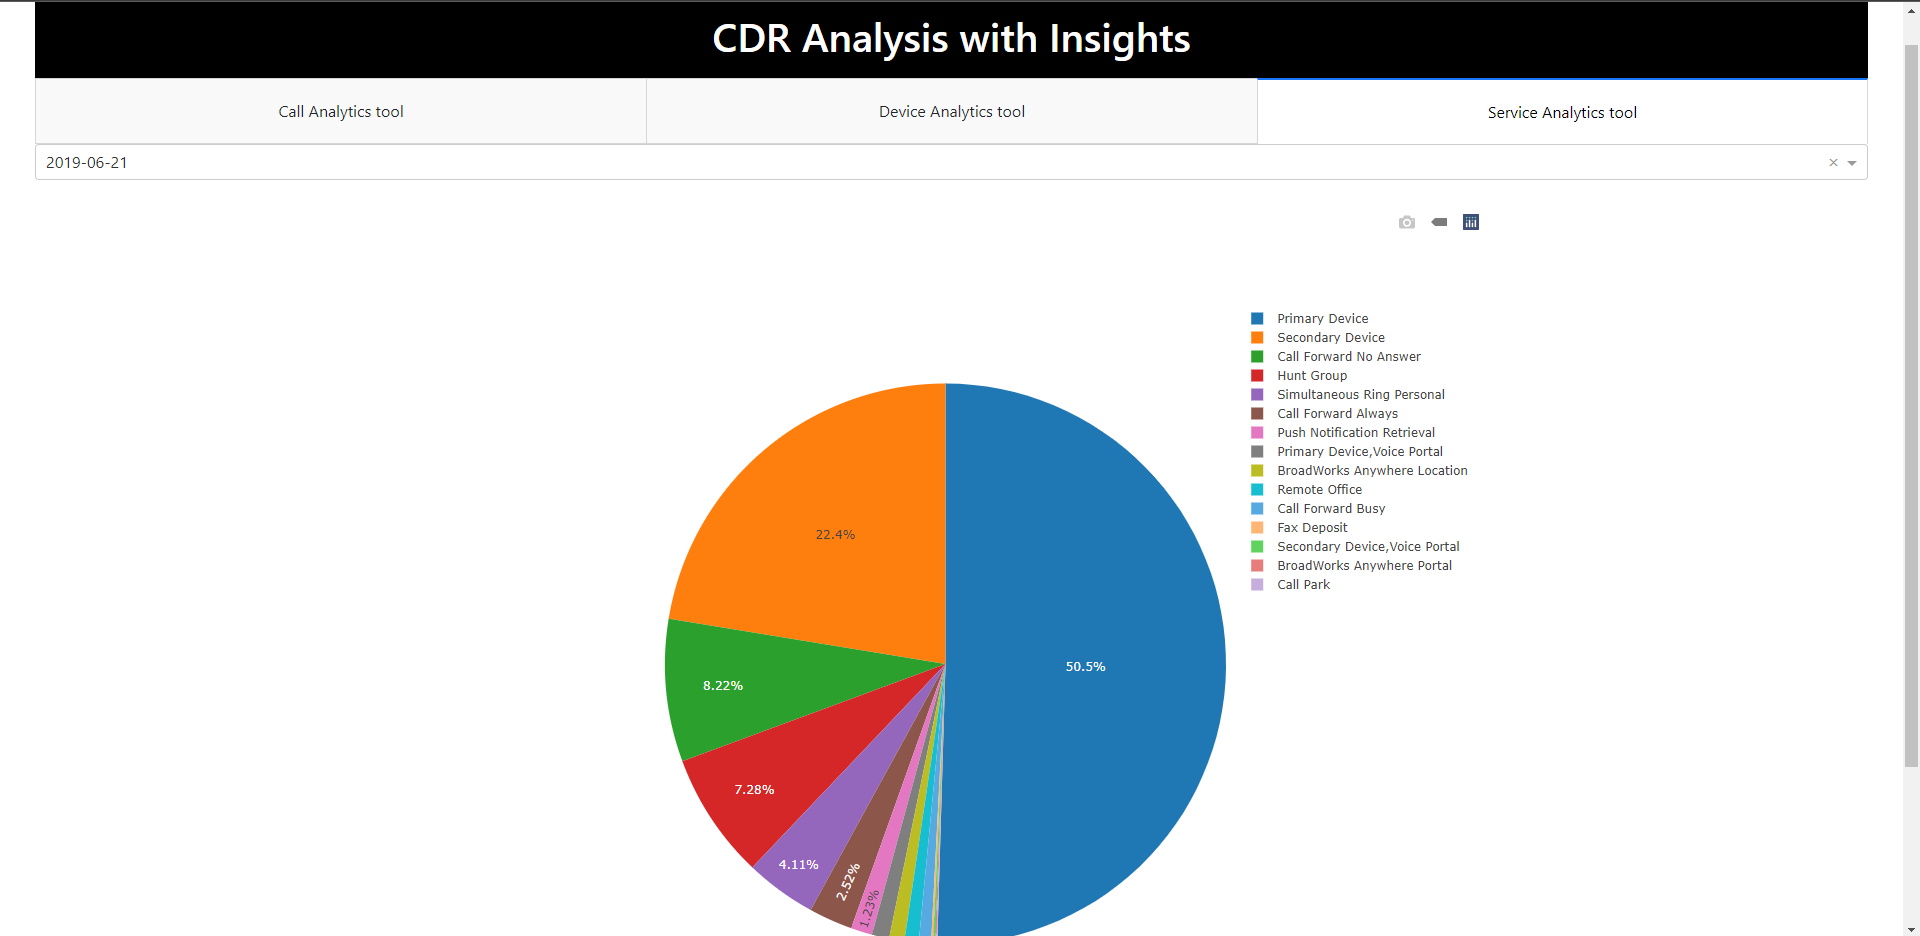
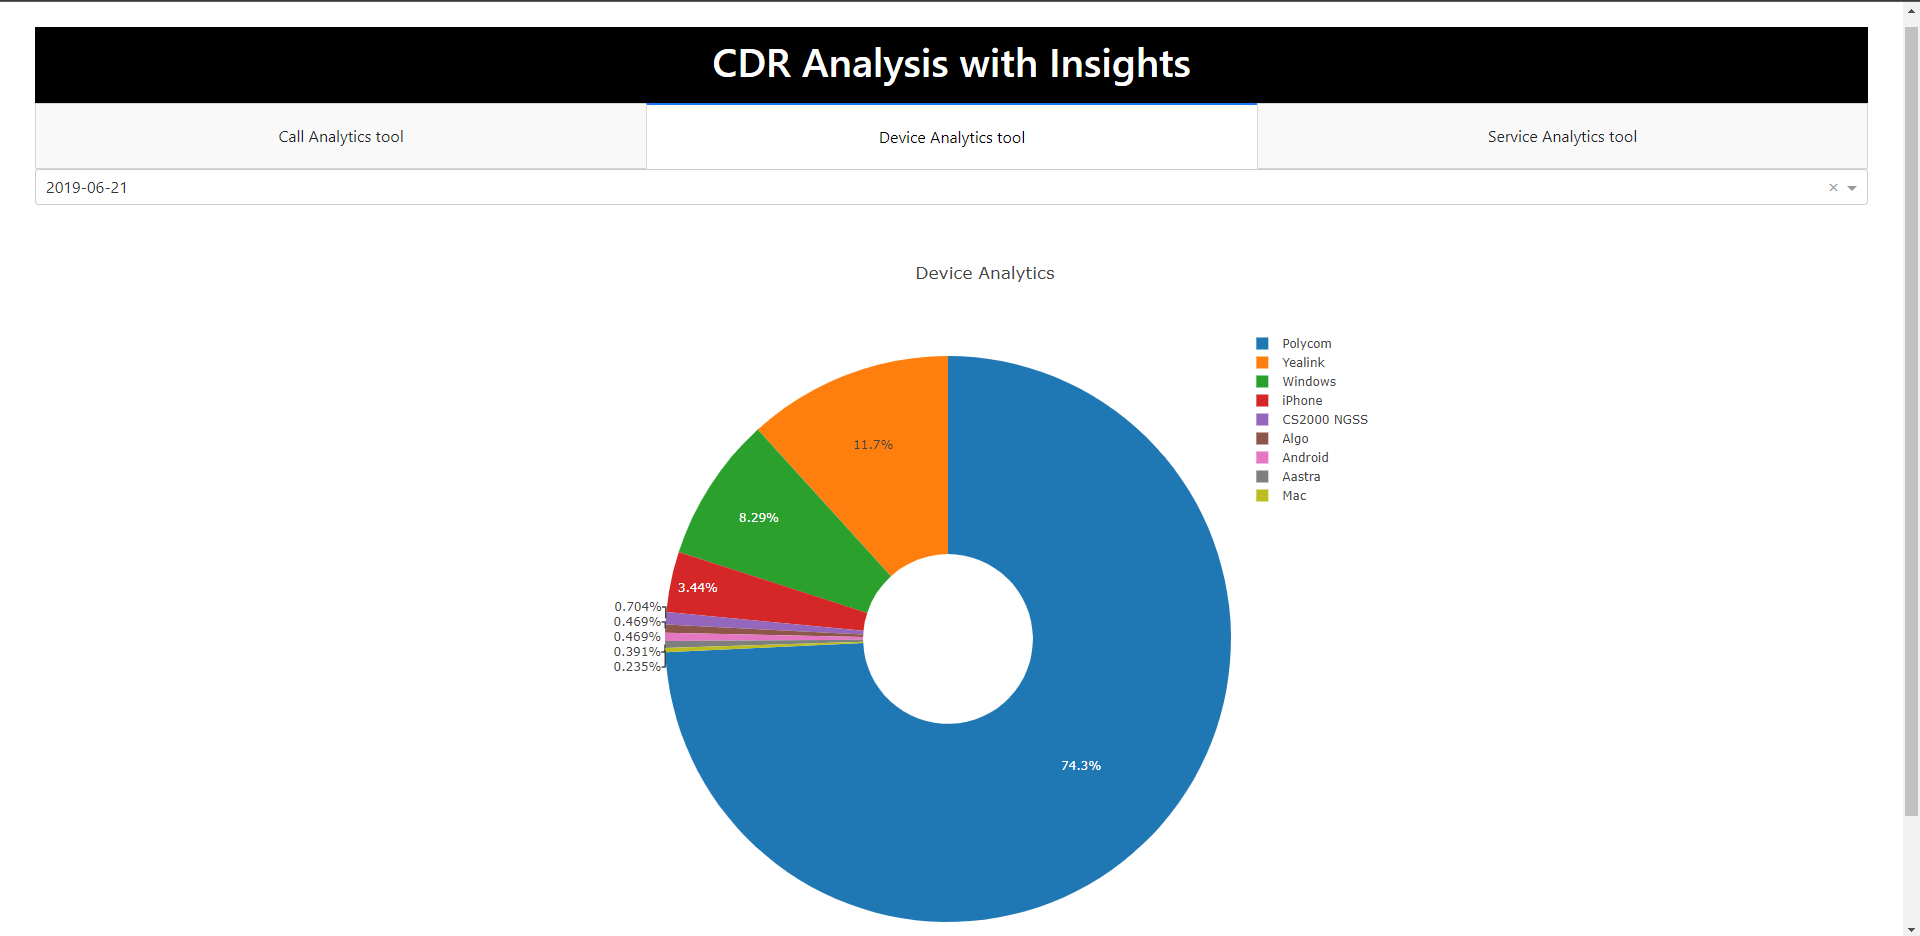
UI should have a Device Data Analytics and Service Data Analytics (Interactive Visualisation) to generate a Pie Chart.
-
We would be going to use Agile Methodology.
My LinkedIn