In this project I used VBA scripting to analyze real stock market data.
-
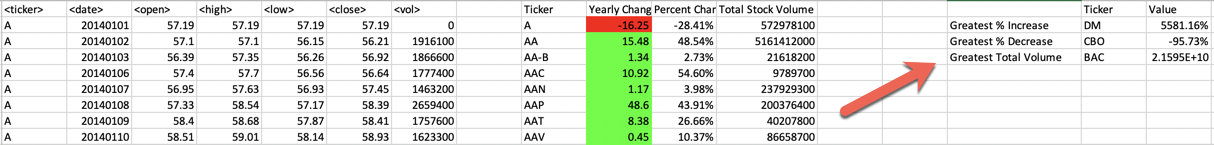
Created a script that will loop through all the stocks for one year and output the following information.
-
The ticker symbol.
-
Yearly change from opening price at the beginning of a given year to the closing price at the end of that year.
-
The percent change from opening price at the beginning of a given year to the closing price at the end of that year.
-
The total stock volume of the stock.
-
Return the stock with the "Greatest % increase", "Greatest % decrease" and "Greatest total volume".
-
Made the appropriate adjustments to my VBA script that will allow it to run on every worksheet.
-
-
[Test Data] - Used this while I was developing my scripts.
-
[Stock Data] - Ran my scripts on this data to generate the final report.
- Excel -VBA Script
© hej6853