ZozkaStrategyVisualizer Examples
StrategyVisualiser is a application to draw.
- charts for EOD on stock algorithms for selected stock (datafeed), period;
- charts for EOD trading strategies for selected datafeed, period.
Image 1. Print Screen For On Stock Algorithm Example

Image 2. Print Screen For On Stock Algorithm Example

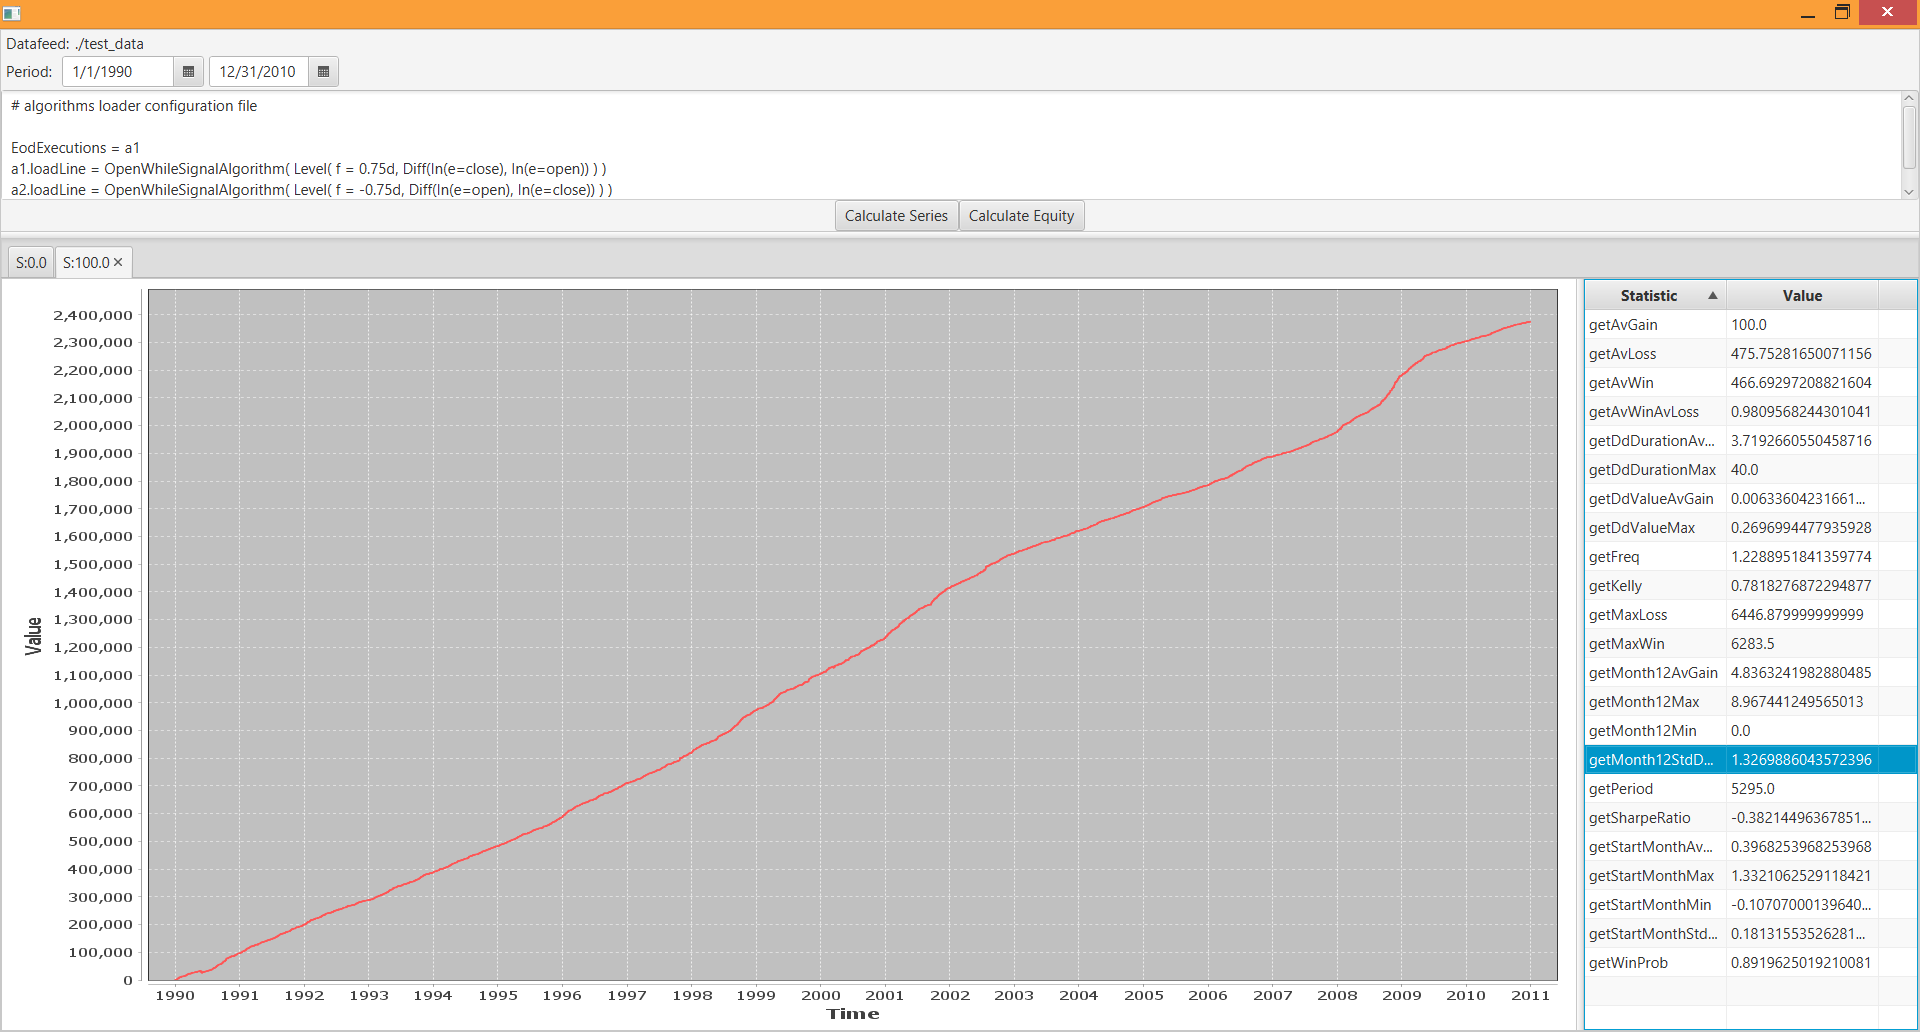
Image 3. Print Screen For Equity Curve Example

Image 4. Print Screen For Equity Curve Example